

What is the Relative Strength Index (RSI)
A simple way of understanding market momentum.


If you’ve ever wondered whether a stock is overhyped or undervalued, the Relative Strength Index (RSI) is your new best friend. Think of it as a stock market thermometer, measuring the heat (momentum) of a stock’s price movement.
Breaking It Down: The RSI in Simple Terms
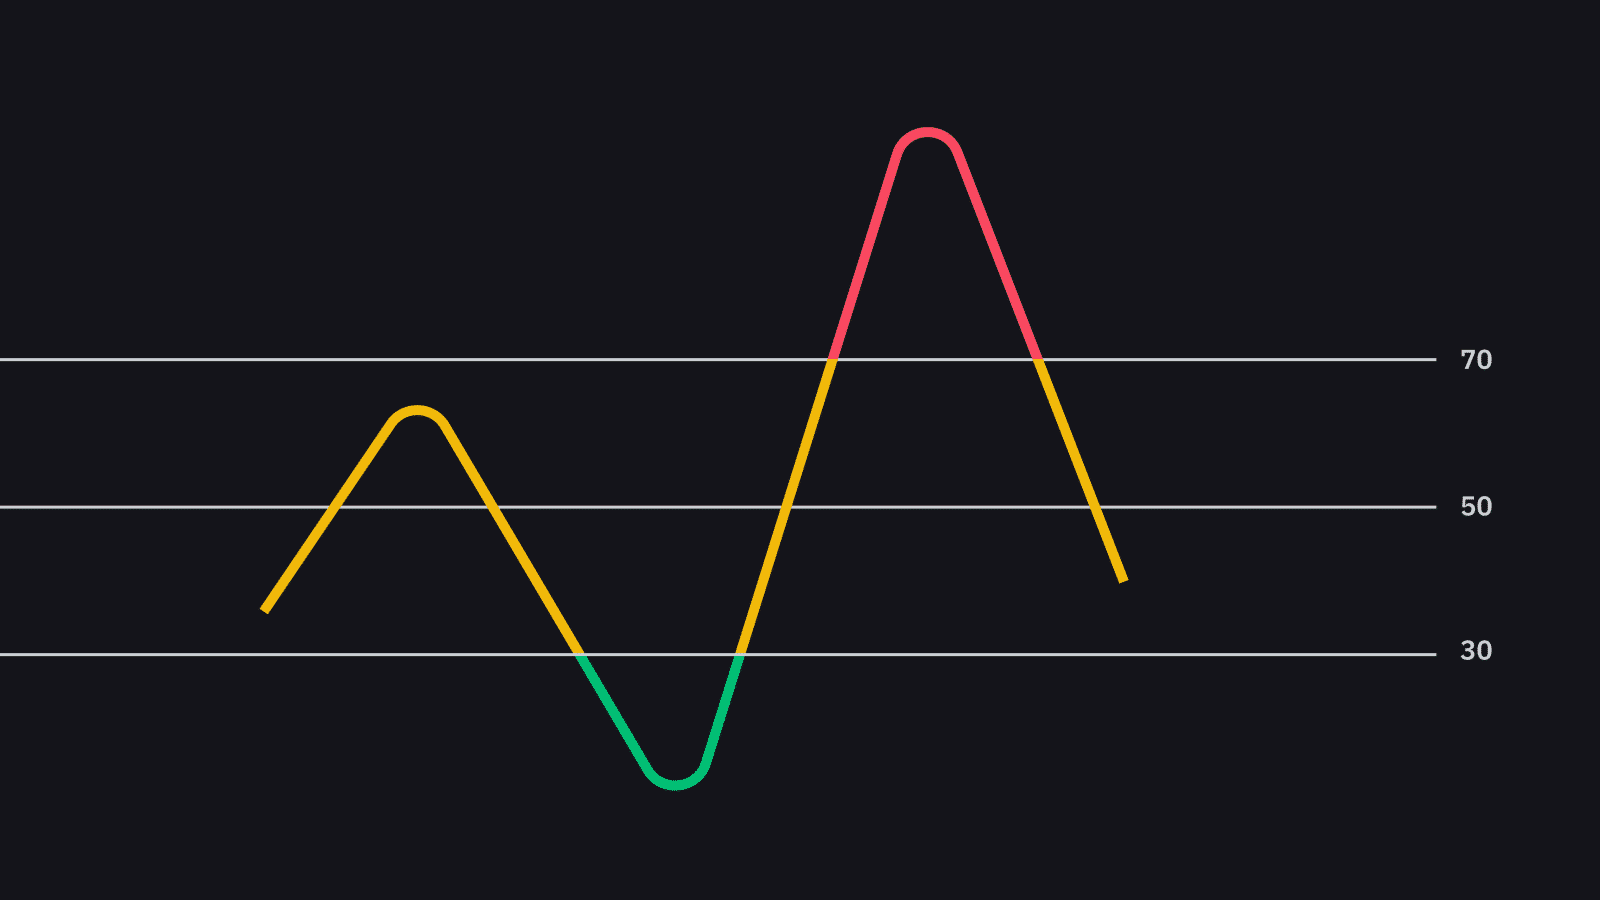
RSI is a technical indicator that tells traders whether a stock is overbought (too expensive) or oversold (too cheap). It’s measured on a scale of 0 to 100, with:
Above 70 = The stock might be overbought (time to cool off)
Below 30 = The stock might be oversold (potential bargain alert!)
The Gym Analogy: When a Stock Needs a Break
Imagine you’re at the gym doing push-ups. If you keep going without a break, eventually, you’ll get exhausted and need to rest. That’s what happens when a stock becomes overbought… it’s been climbing too fast and might need to take a breather.
On the flip side, if you haven’t exercised in a while and suddenly start working out, you have a lot of energy to burn. That’s like an oversold stock…it’s been dropping too much and might be ready for a comeback.
How Traders Use RSI
Spotting Reversals: If a stock’s RSI is above 70, it might be time to sell before the price drops. If it’s below 30, it could be a buying opportunity.
Confirming Trends: RSI can help traders confirm whether a trend is strong or weakening. If RSI stays above 50, the stock is likely in an uptrend; if below 50, it might be in a downtrend.
Divergences: If a stock’s price is making new highs but RSI isn’t, it could signal that momentum is weakening and a reversal is coming.
A Quick Example
Let’s say Stock ABC has been skyrocketing, and its RSI hits 75. This could mean it's overbought, and a drop might be on the way. On the other hand, if Stock XYZ has been tanking and its RSI is 25, it might be oversold and ready to bounce back.
Wrapping Up
RSI is like a heartbeat monitor for stocks. It helps traders gauge whether prices are moving too fast or too slow. While it’s a great tool, it works best when combined with other indicators for a fuller picture of market trends. Next time you're analyzing a stock, check the RSI and see what the momentum is telling you!
Quick Glossary
RSI (Relative Strength Index): A momentum indicator that measures whether a stock is overbought or oversold.
Overbought: A condition where a stock has risen too much and may be due for a pullback.
Oversold: A condition where a stock has fallen too much and may be due for a rebound.
Divergence: A situation where the RSI and the stock price move in opposite directions, signaling a possible trend change.