


What is MACD?
The market's momentum detector


MACD (Moving Average Convergence Divergence) is a fancy way of saying: "Are buyers or sellers driving faster right now?" Think of it as the market’s speedometer, showing momentum shifts so traders can spot potential trend changes. It helps traders determine when a stock might be gaining or losing momentum, making it a valuable tool for timing trades.
Breaking It Down: The Two Moving Averages
Think of MACD like a relay race with two runners:
The first runner (12-period moving average) is the sprinter, quick and reactive to changes.
The second runner (26-period moving average) is more of a marathoner, steady but slower to adjust.
If the sprinter starts pulling ahead, it signals an increase in momentum: buyers are gaining strength (bullish signal). If the sprinter starts lagging behind the marathoner, momentum is slowing down: sellers might be taking control (bearish signal).
Why does this matter? Because trends in the market don’t change instantly; they shift gradually. By comparing these two runners, MACD helps traders see the change in momentum early and prepare for potential trend shifts.
The MACD Line and Signal Line: Who’s Leading?
The MACD line is the difference between the fast and slow moving averages. Then, there’s a Signal Line, which is a 9-period moving average of the MACD line. Think of it as your co-driver, smoothing out the bumps and giving a heads-up before turns.
When the MACD line crosses above the Signal Line → potential buy signal (momentum shifting up)
When the MACD line crosses below the Signal Line → potential sell signal (momentum shifting down)
Traders use these crossovers as clues. When MACD crosses above the Signal Line, it's like stepping on the gas; when it crosses below, it's like tapping the brakes.
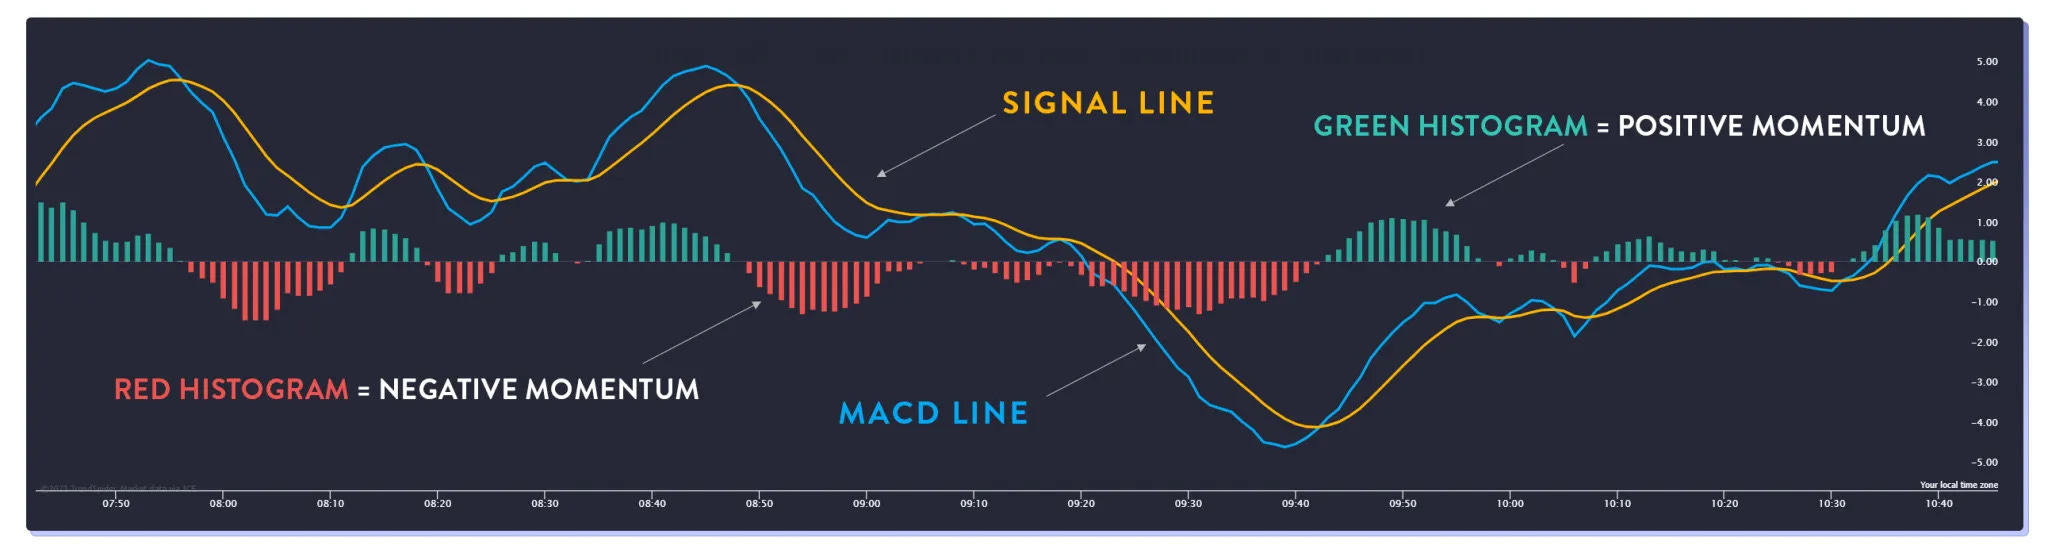
The MACD Histogram: Visualizing the Gaps
The histogram shows the gap between the MACD and Signal Line. Picture this as the space between two runners:
If the gap is widening, one runner is pulling away (momentum strengthening).
If the gap is shrinking, the runners are catching up (momentum weakening, possible reversal coming).
Larger histogram bars suggest stronger trends, while smaller bars indicate a possible slowdown or reversal.
How Traders Use MACD
Crossovers: When the MACD line crosses above the Signal Line, traders look for a buying opportunity. When it crosses below, they consider selling.
Divergence: If MACD moves in the opposite direction of the price, it can hint at a potential trend reversal.
Zero Line: When MACD crosses above zero, buyers are gaining strength. Below zero, sellers are in control.
Histogram Changes: Increasing bars show strengthening momentum, while shrinking bars may indicate an upcoming shift in trend.
Limitations of MACD
While MACD is a great tool, it’s not perfect. Since it’s based on moving averages, it can lag behind price action. This means traders might get signals after a trend has already started. To counter this, traders often combine MACD with other indicators, such as RSI or support/resistance levels, for confirmation.
Wrapping Up
MACD is like reading speed changes on the market’s highway. If momentum is increasing, you might want to ride the trend. If it’s slowing down, caution might be needed. By understanding the MACD’s signals, you can make smarter trading decisions without second-guessing every move. However, always use it alongside other tools for a clearer picture of the market.
Quick Glossary
MACD (Moving Average Convergence Divergence): A momentum indicator showing trend direction and strength.
Moving Average: An average of past prices to smooth out price action.
MACD Line: The difference between the 12-period and 26-period moving averages.
Signal Line: A 9-period moving average of the MACD line, used to generate trade signals.
Histogram: A visual representation of the gap between the MACD and Signal Line.
Divergence: When MACD moves opposite to price action, signaling a possible reversal.
I wish I had read this post 9 years ago when I started investing. It took me years to know how to use MACD to detect trends. I started using MACD a few years ago and it took me a lot of trial and error to understand it. This post would have saved me a lot of time. Now, I used MACD in the PIMM Trading System. The third “M” is MACD.